Information is better when it can be easily understood. However, it can be difficult to present data in a way that is both informative and easy to read. Infographics help combat this problem.
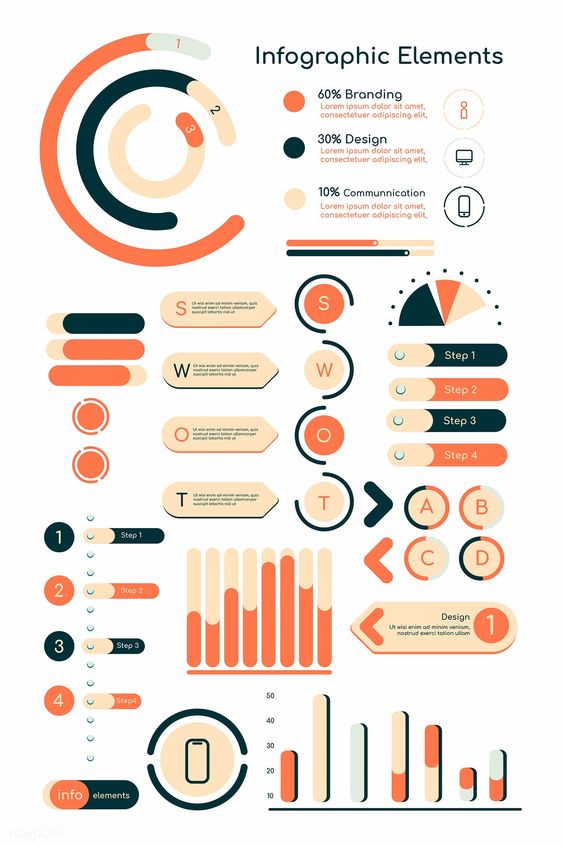
An infographic is a visual representation of any kind of information or data.
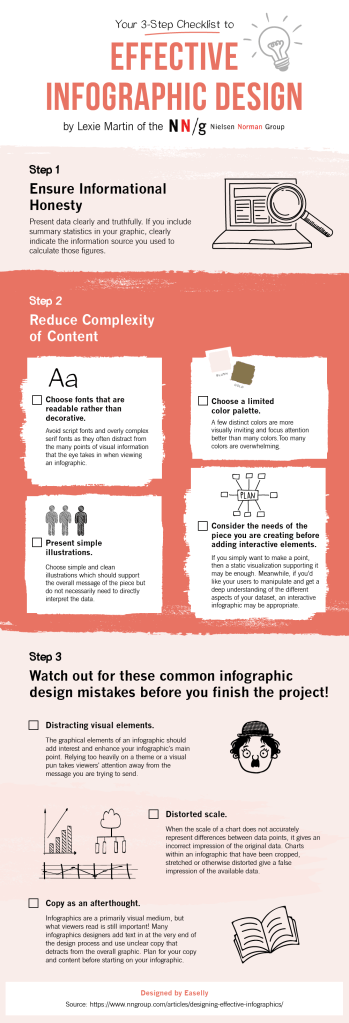
There are 4 steps to making useful, relevant infographic content.
- Determine the usefulness
- Find out if it is relevant to your audience
- Make sure you have a good design
- Envision the creation outcomes for your infographic
When done correctly, infographics can be super impactful and informative. Here are some examples of great infographics: https://www.designhill.com/design-blog/best-infographics-designs/

In conclusion, infographics are a fantastic way to help users understand data, and it’s worth the time to learn how to make good ones.
